AntV 开发
一、AntV X6
概念
X6 是 AntV 旗下的图编辑引擎。 提供简单易用的节点定制能力和开箱即用的交互组件,方便我们快速搭建流程图、DAG 图、ER 图等图应用
二、特性
- 🌱 极易定制:支持使用 SVG/HTML/React/Vue/Angular 定制节点样式和交互
- 🚀 开箱即用:内置 10+ 图编辑配套扩展,如框选、对齐线、小地图等
- 🧲 数据驱动:基于 MVC 架构,用户更加专注于数据逻辑和业务逻辑
- 💯 事件驱动:完备的事件系统,可以监听图表内发生的任何事件
三、初始化 VUE3 项目
js
// 1. 安装脚手架依赖
npm create vue@3

// 2. 回车 - create project
// 2.1 输入项目名: antv-x6
// 2.2 选择自定义配置项

// 3. 运行
cd antv-x6
npm install
npm run dev四、VUE3 中引入@antv/x6
js
// npm
npm install @antv/x6 --save

// yarn
yarn add @antv/x6五、创建画布
vue
<script setup>
import { onMounted, ref } from 'vue'
import { Graph } from '@antv/x6'

let container
let graph

// 挂载完成后
onMounted(() => {
  container = document.getElementById('container')
  getData()
})

// 加载数据创建画布
const getData = () => {
  createGraph()
}

// 创建画布
const createGraph = () => {
  graph = new Graph({
    container: container,
    width: 1500,
    height: 800,
    background: { color: '#08ffff' }, // 创建画布时初始化背景相关配置对象
    grid: { size: 10, visible: true, type: 'mesh' } //创建画布时,通过配置对象来设置背景网格
  })
}
</script>

<template>
  <div id="container"></div>
</template>

<style scoped></style>六、完整实例
6.1 引入 @antv/layout
js
yarn add @antv/layout6.2 修改 App.vue 文件:
vue
<script setup>
import { onMounted, ref } from 'vue'
import { Graph } from '@antv/x6'
import { GridLayout, DagreLayout } from '@antv/layout' // 布局算法

import { data } from './mock/data'

let container
let graph

// 层次布局
// 按照不同的需求,选用合适的布局算法,让画布中的图形规律分布
const dagreLayout = new DagreLayout({
  type: 'dagre',
  rankdir: 'TB',
  align: 'DR',
  ranksep: 80,
  nodesep: 20,
  controlPoints: true
})
const newModel = dagreLayout.layout(data)

// 挂载完成后
onMounted(() => {
  container = document.getElementById('container')
  getData()
})

// 加载数据创建画布
const getData = () => {
  createGraph(newModel)
}

// 创建画布
const createGraph = (newModel) => {
  graph = new Graph({
    container: container,
    width: 600,
    height: 600,
    background: { color: '#f00' }, // 创建画布时初始化背景相关配置对象
    grid: { size: 10, visible: true, type: 'mesh' } //创建画布时,通过配置对象来设置背景网格
  })

  graph.fromJSON(newModel)
  graph.drawBackground({ color: '#999999' }) // 创建画布后也可调用方法重绘背景
  graph.drawGrid({ type: 'mesh' }) // 创建画布后也可调用方法重绘画布网格
  graph.zoom(0.5) // 画布和图形整体的缩放
  graph.translate(200, 40) // 图形相对画布的相对位置,平移
  graph.centerContent() // 将画布内容中心与视口中心对齐
}
</script>

<template>
  <div id="container"></div>
</template>

<style scoped></style>6.3 Mock 数据
新建 src/mock/data.js 文件:
js
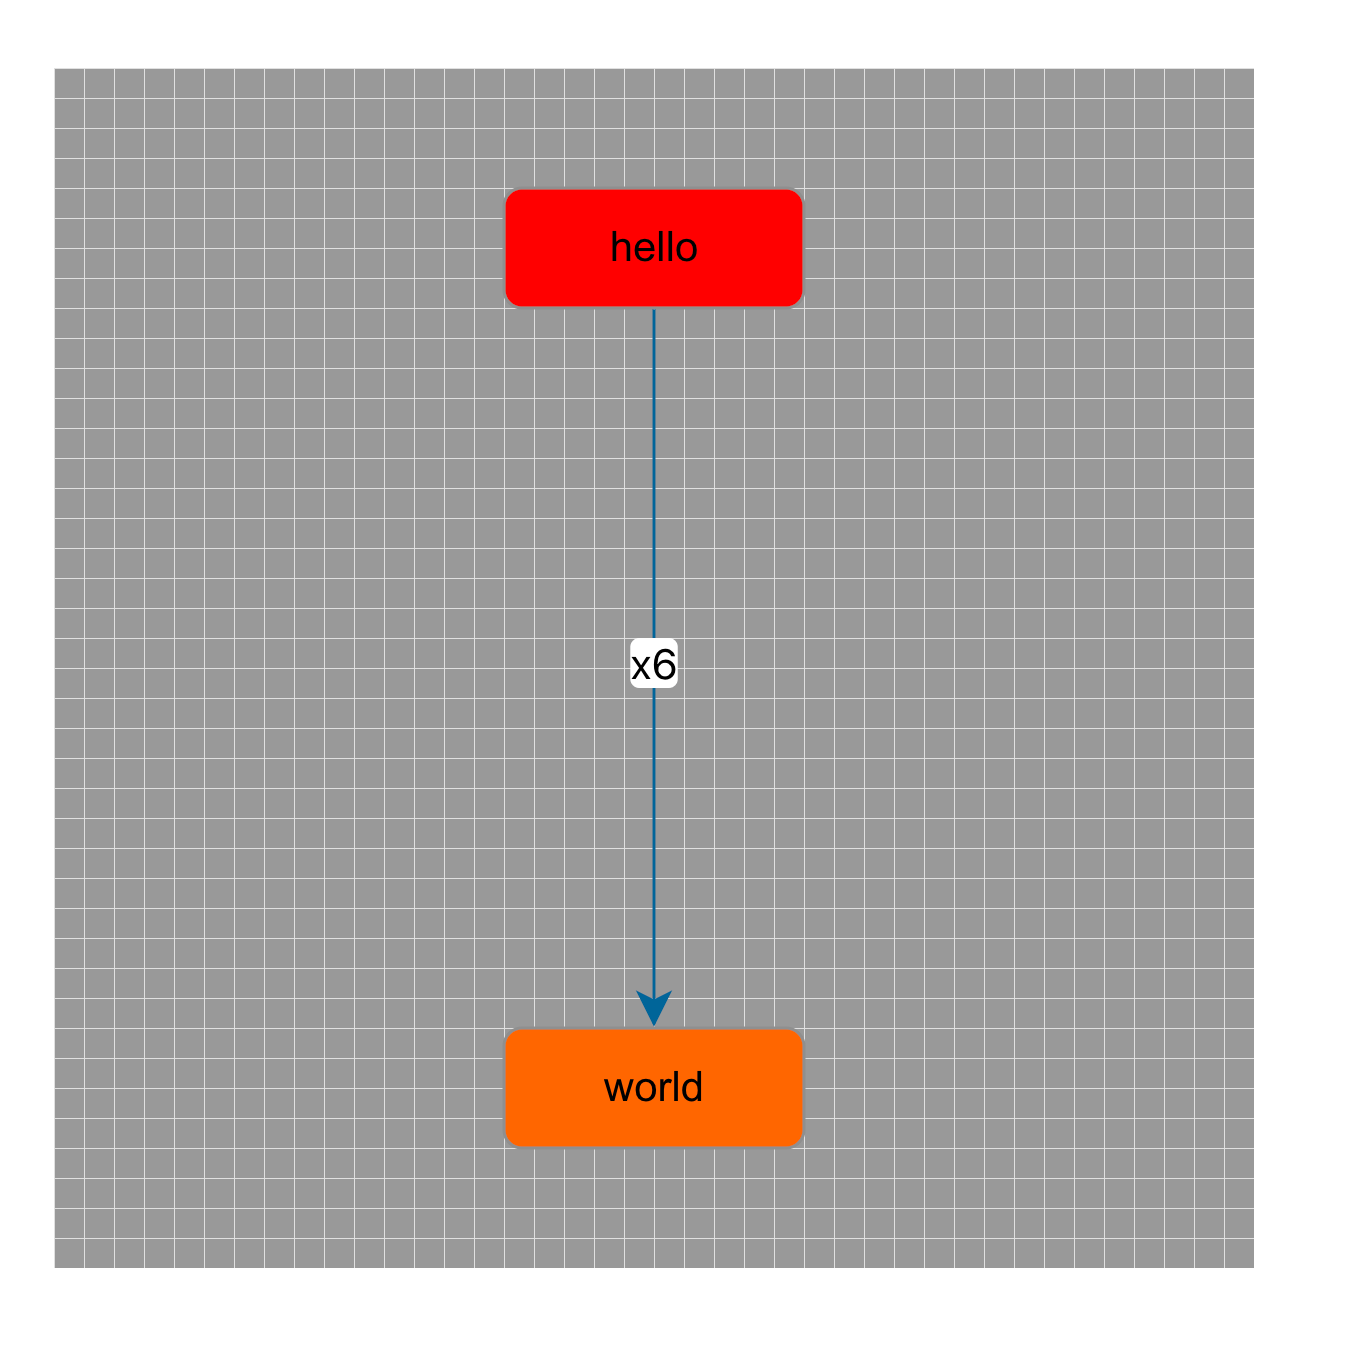
export const data = {
  nodes: [
    {
      id: 'node1',
      shape: 'rect',
      x: 40,
      y: 40,
      width: 100,
      height: 40,
      label: 'hello',
      attrs: {
        // body 是选择器名称,选中的是 rect 元素
        body: {
          stroke: '#8f8f8f',
          strokeWidth: 1,
          fill: '#f00',
          rx: 6,
          ry: 6
        }
      }
    },
    {
      id: 'node2',
      shape: 'rect',
      x: 160,
      y: 180,
      width: 100,
      height: 40,
      label: 'world',
      attrs: {
        body: {
          stroke: '#8f8f8f',
          strokeWidth: 1,
          fill: '#f60',
          rx: 6,
          ry: 6
        }
      }
    }
  ],
  edges: [
    {
      shape: 'edge',
      source: 'node1',
      target: 'node2',
      label: 'x6',
      attrs: {
        // line 是选择器名称,选中的边的 path 元素
        line: {
          stroke: '#069',
          strokeWidth: 1
        }
      }
    }
  ]
}6.4 运行效果