1)ECharts 实现可视化
可视化的核心价值在于通过图形和交互的方式,把复杂的数据和信息转化为直观、易理解的表达形式,从而帮助用户快速洞察、分析和决策。
可视化的目的不仅仅是“展示数据”,更重要的是“让数据说话”。无论是从简化信息、发现洞察还是辅助决策的角度,可视化都在现代数据驱动型场景中发挥着不可替代的作用。
提示
- 一定要多看官方文档,多看示例!
- 一定要多看官方文档,多看示例!
- 一定要多看官方文档,多看示例!
一、官网
- ECharts:百度开源,功能丰富,适合各种常见图表。
二、基本使用
1. 引入
推荐使用 npm 方式引入,以便于管理依赖。
bash
npm install echarts --save

# OR
yarn add echarts2. 准备容器、封装组件
编写一个通用的 ECharts 组件,接收 props,并挂载到 DOM 上。
vue
<!-- File: src/components/Echarts.vue -->
<template>
  <div ref="chartRef" :style="{ width: width, height: height }"></div>
</template>

<script lang="ts" setup>
import { ref, watch, onMounted, onBeforeUnmount } from "vue";
import * as echarts from "echarts";

// 接收 props
const propsOptions = defineProps({
  width: {
    type: String,
    default: "100%",
  },
  height: {
    type: String,
    default: "400px",
  },
  options: {
    type: Object,
    required: true,
  },
});

const chartRef = ref(null);
let chartInstance: echarts.ECharts | null = null;

// 初始化图表
const initChart = () => {
  if (chartRef.value) {
    chartInstance = echarts.init(chartRef.value);
    chartInstance.setOption(propsOptions.options);

    // 示例:添加点击事件
    chartInstance.on("click", (params) => {
      console.log("图表点击事件:", params);
    });
  }
};

// 监听窗口变化,动态调整图表大小
const resizeChart = () => {
  if (chartInstance) {
    chartInstance.resize();
  }
};

// 监听 options 的变化
watch(
  () => propsOptions.options,
  (newOptions) => {
    if (chartInstance) {
      chartInstance.setOption(newOptions); // 更新配置
    }
  },
  { deep: true }
);

onMounted(() => {
  initChart();
  window.addEventListener("resize", resizeChart);
});

onBeforeUnmount(() => {
  if (chartInstance) {
    chartInstance.dispose(); // 销毁实例
  }
  window.removeEventListener("resize", resizeChart);
});
</script>

<style scoped>
/* 可以根据需求添加默认样式 */
</style>3. 图表数据配置
引入上面封装好的
ECharts组件,并传入图表的配置项options。
vue
<!-- File: src/views/dashboard/index.vue -->
<template>
  <div>
    <ECharts :options="chartOptions" height="500px" />
  </div>
</template>

<script lang="ts" setup>
import { reactive } from "vue";
import ECharts from "@/components/ECharts.vue";

// 响应式图表配置
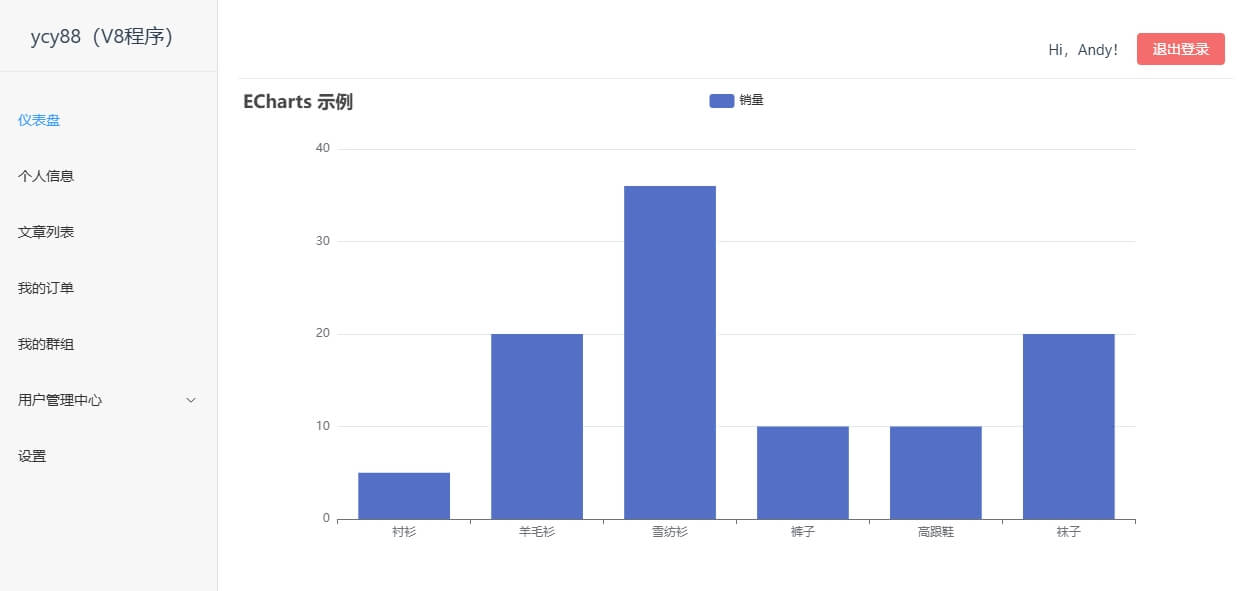
const chartOptions = reactive({
  title: {
    text: "ECharts 示例",
  },
  tooltip: {},
  legend: {
    data: ["销量"],
  },
  xAxis: {
    data: ["衬衫", "羊毛衫", "雪纺衫", "裤子", "高跟鞋", "袜子"],
  },
  yAxis: {},
  series: [
    {
      name: "销量",
      type: "bar",
      data: [5, 20, 36, 10, 10, 20],
    },
  ],
});
</script>

<style>
/* 全局样式 */
</style>4. 效果截图

三、常用配置项
1. 标题配置
js
  title: {
    text: '主标题',
    subtext: '副标题',
    left: 'center', // 标题位置
},2. 工具提示框
js
  tooltip: {
    trigger: 'axis', // 触发类型,'item' 或 'axis'
    formatter: '{b}: {c}', // 提示内容格式
},3. 图例配置
js
  legend: {
    data: ['系列1', '系列2'],
    top: '10%',
},四、常用图表
1. 折线图
js
series: [
  {
    name: '数据',
    type: 'line',
    data: [10, 22, 28, 43, 49, 62],
  },
],2. 柱状图
js
series: [
  {
    name: '销量',
    type: 'bar',
    data: [12, 20, 36, 10, 10, 40],
  },
],3. 饼图
js
series: [
  {
    name: '访问来源',
    type: 'pie',
    radius: '50%',
    data: [
      { value: 335, name: '直接访问' },
      { value: 310, name: '邮件营销' },
      { value: 274, name: '联盟广告' },
      { value: 235, name: '视频广告' },
      { value: 400, name: '搜索引擎' },
    ],
  },
],4. 地图
js
series: [
  {
    type: 'map',
    map: 'china', // 地图类型,例如 'world' 或 'china'
  },
],五、注意事项
- 容器尺寸:确保图表容器有明确的宽度和高度。
- 问题:如果图表容器没有明确的宽度和高度,ECharts 无法确定绘制区域,图表可能无法正确显示,甚至直接报错或空白。
- 表现:页面上没有渲染图表,或者图表过小/过大导致失真。
- 数据格式:数据格式需要与配置项匹配,避免渲染错误。
- 问题:配置项中数据的格式与预期不匹配会导致图表渲染失败或部分数据无法正确显示。
- 表现:控制台报错(如
data格式错误)、图表内容显示混乱或不完整,提示框异常。
- 性能优化:对于大规模数据,建议使用
dataZoom或分块加载数据。- 问题:大规模数据直接加载可能导致浏览器卡顿、页面无响应,甚至崩溃。
- 表现:页面加载缓慢、交互卡顿,用户体验差。
- 响应式:监听窗口变化事件,动态调整图表尺寸:
- 问题:如果不监听窗口变化,图表在窗口尺寸发生变化时不会自动调整大小,导致页面布局错乱或部分图表内容不可见。
- 表现:切换设备(如从桌面到移动端)或调整浏览器窗口大小时,图表显示失真、内容被裁剪。
jswindow.addEventListener("resize", () => { myChart.resize(); });